
📊 Data Source
How to monitor your deployed Sentio processor using the UI.
Processor Status
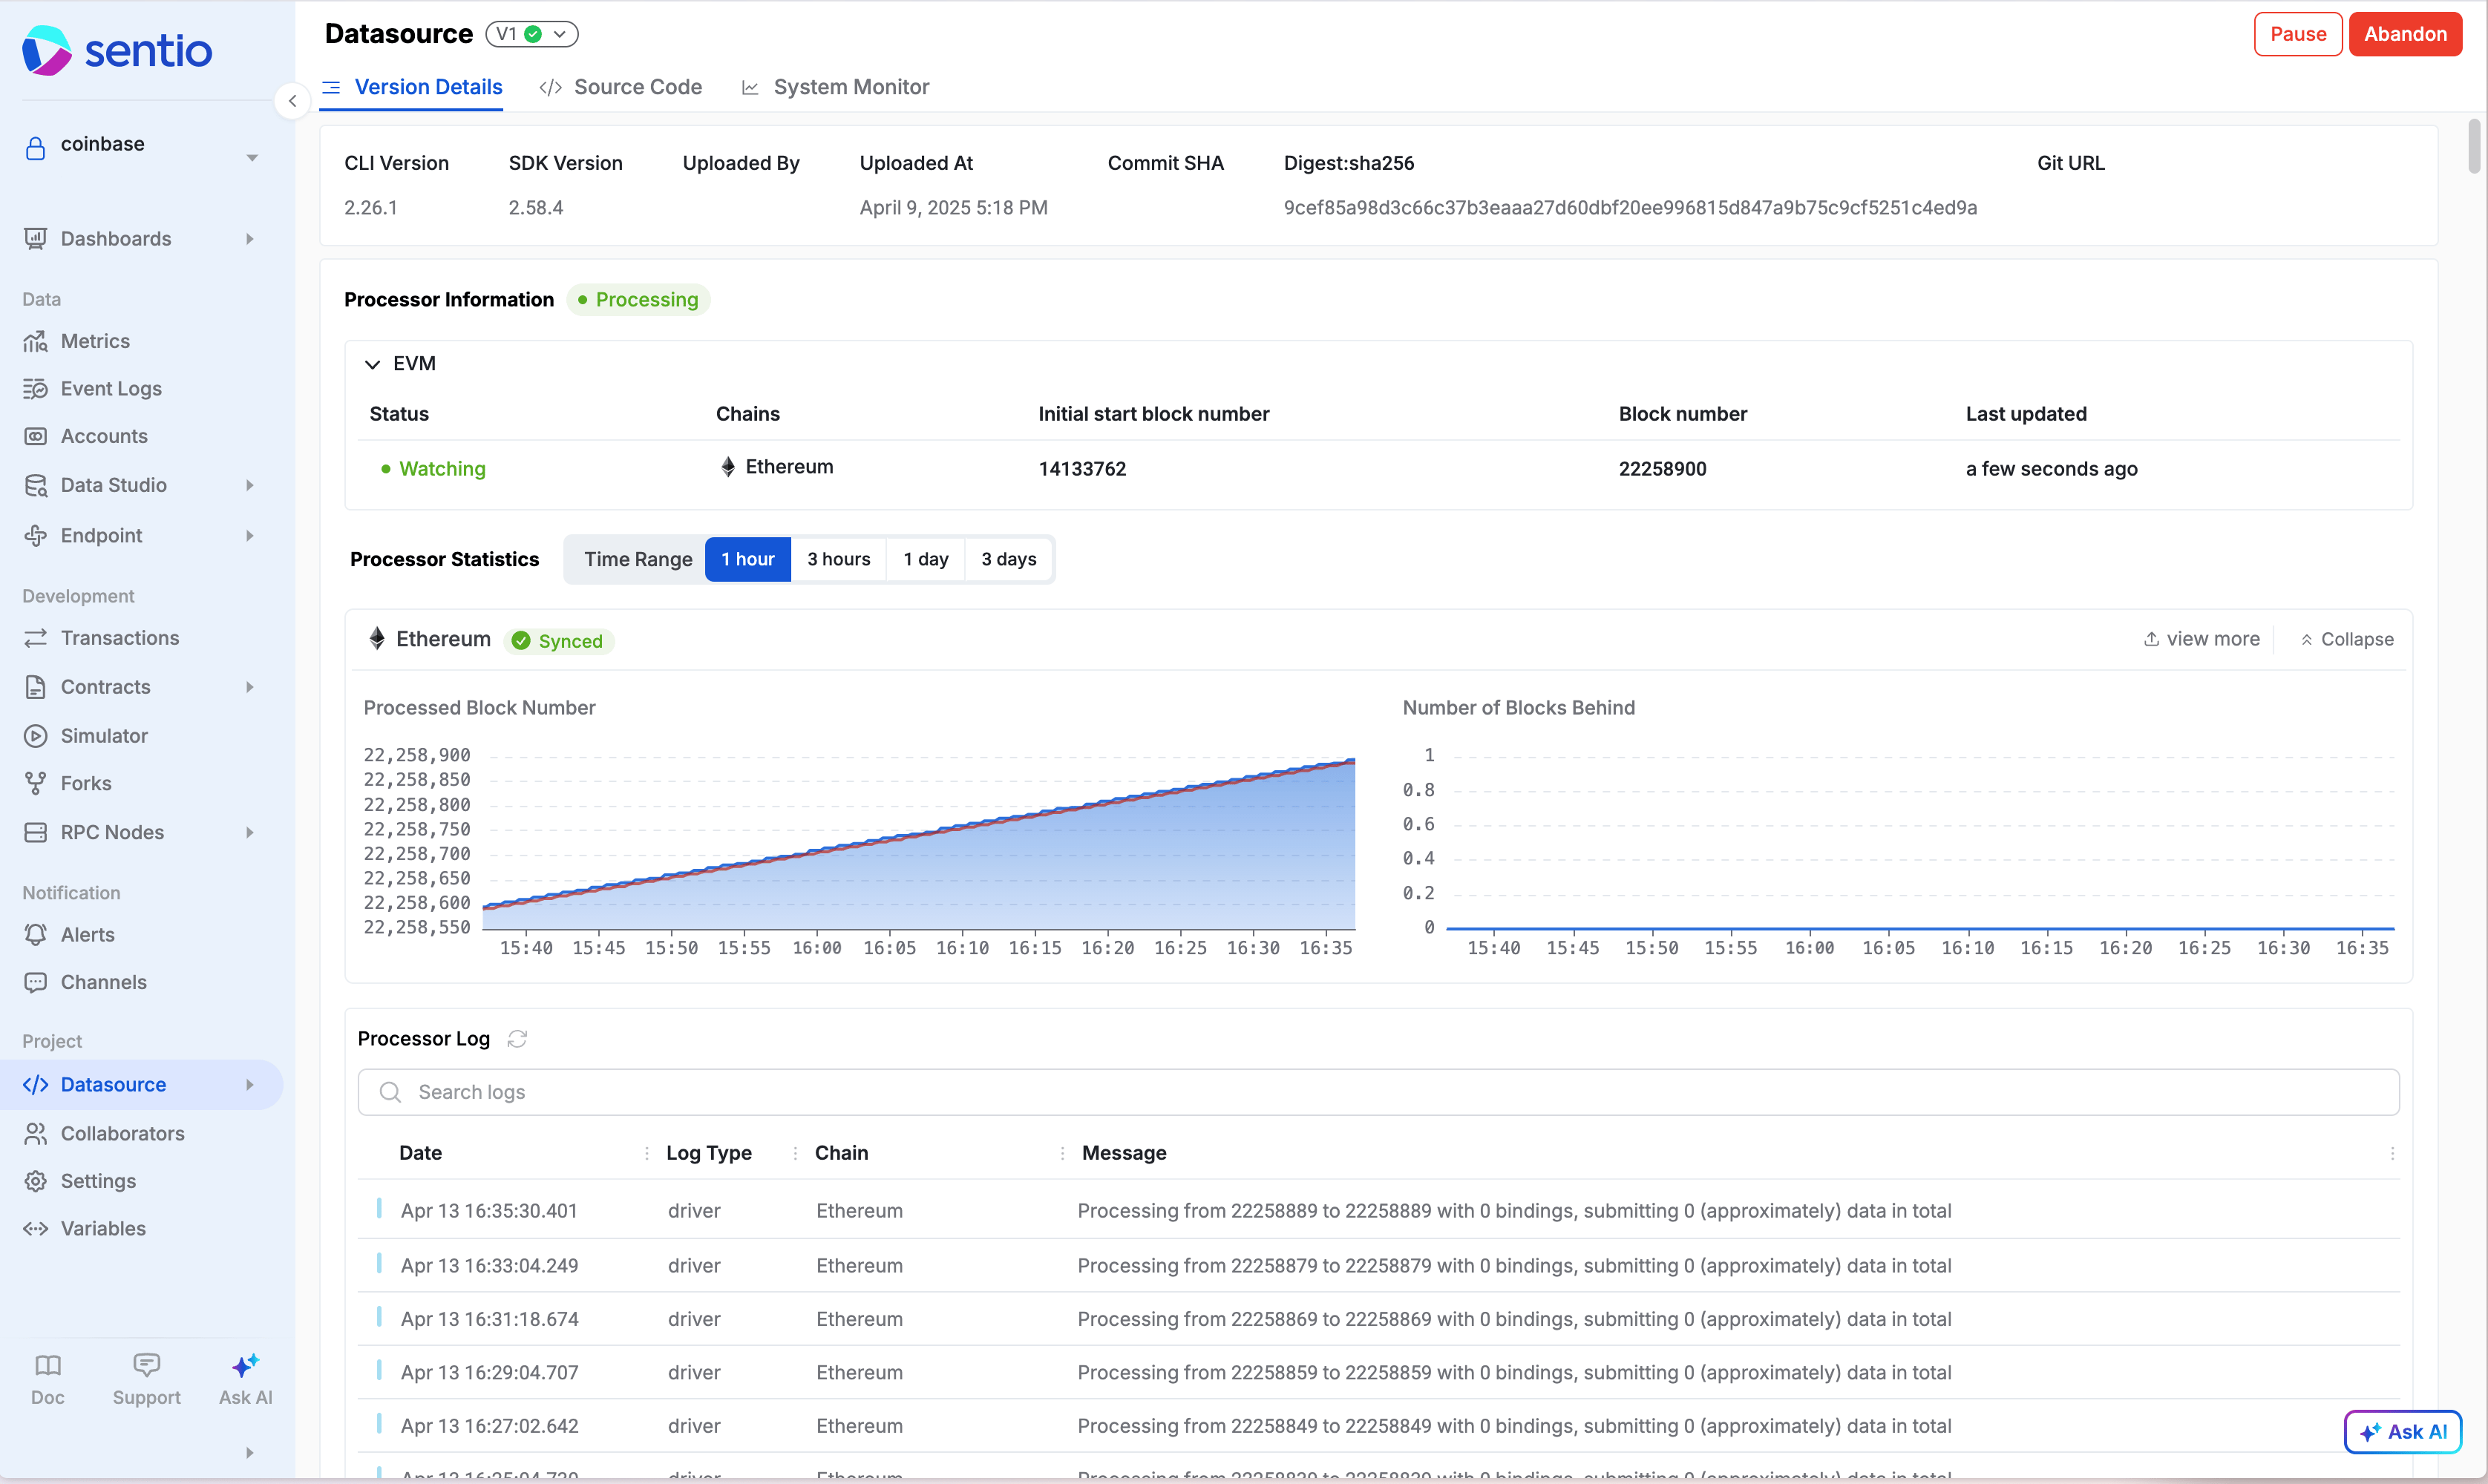
The Data Source page in the Sentio UI is your primary dashboard for monitoring a deployed processor.
-
Status: Check the current state:
STARTING/BOOTSTRAPPING: Initial setup.BACKFILLING: Processing historical data. Shows progress (e.g., current block/version being processed).RUNNING: Actively processing new blocks/transactions near the chain head.ERROR: The processor encountered a fatal error and stopped. Check the Error Status section.STOPPED: Manually stopped or replaced by a new active version.
-
Progress: During backfill, you can see how far along the processor is.
-
Version Details: View the deployed version ID, SDK version, deployment time, etc.
-
Console Logs: Displays output from
console.log()statements in your code. Useful for quick debugging checks, but logs have limited retention (e.g., 3-7 days) and are capped per processor (see Console output limits). -
Error Status: If the processor enters an
ERRORstate, this section usually provides details about the exception or reason for failure. -
System Monitor: Offers insights into resource usage (CPU, memory) and performance metrics, which can help identify bottlenecks.
Basic Debugging with Logs
-
console.log(): Addconsole.log("Debugging info: ", variable1, variable2);statements in your handler logic around areas you suspect might have issues. Deploy the change (sentio upload) and observe the output in the Data Source UI console logs.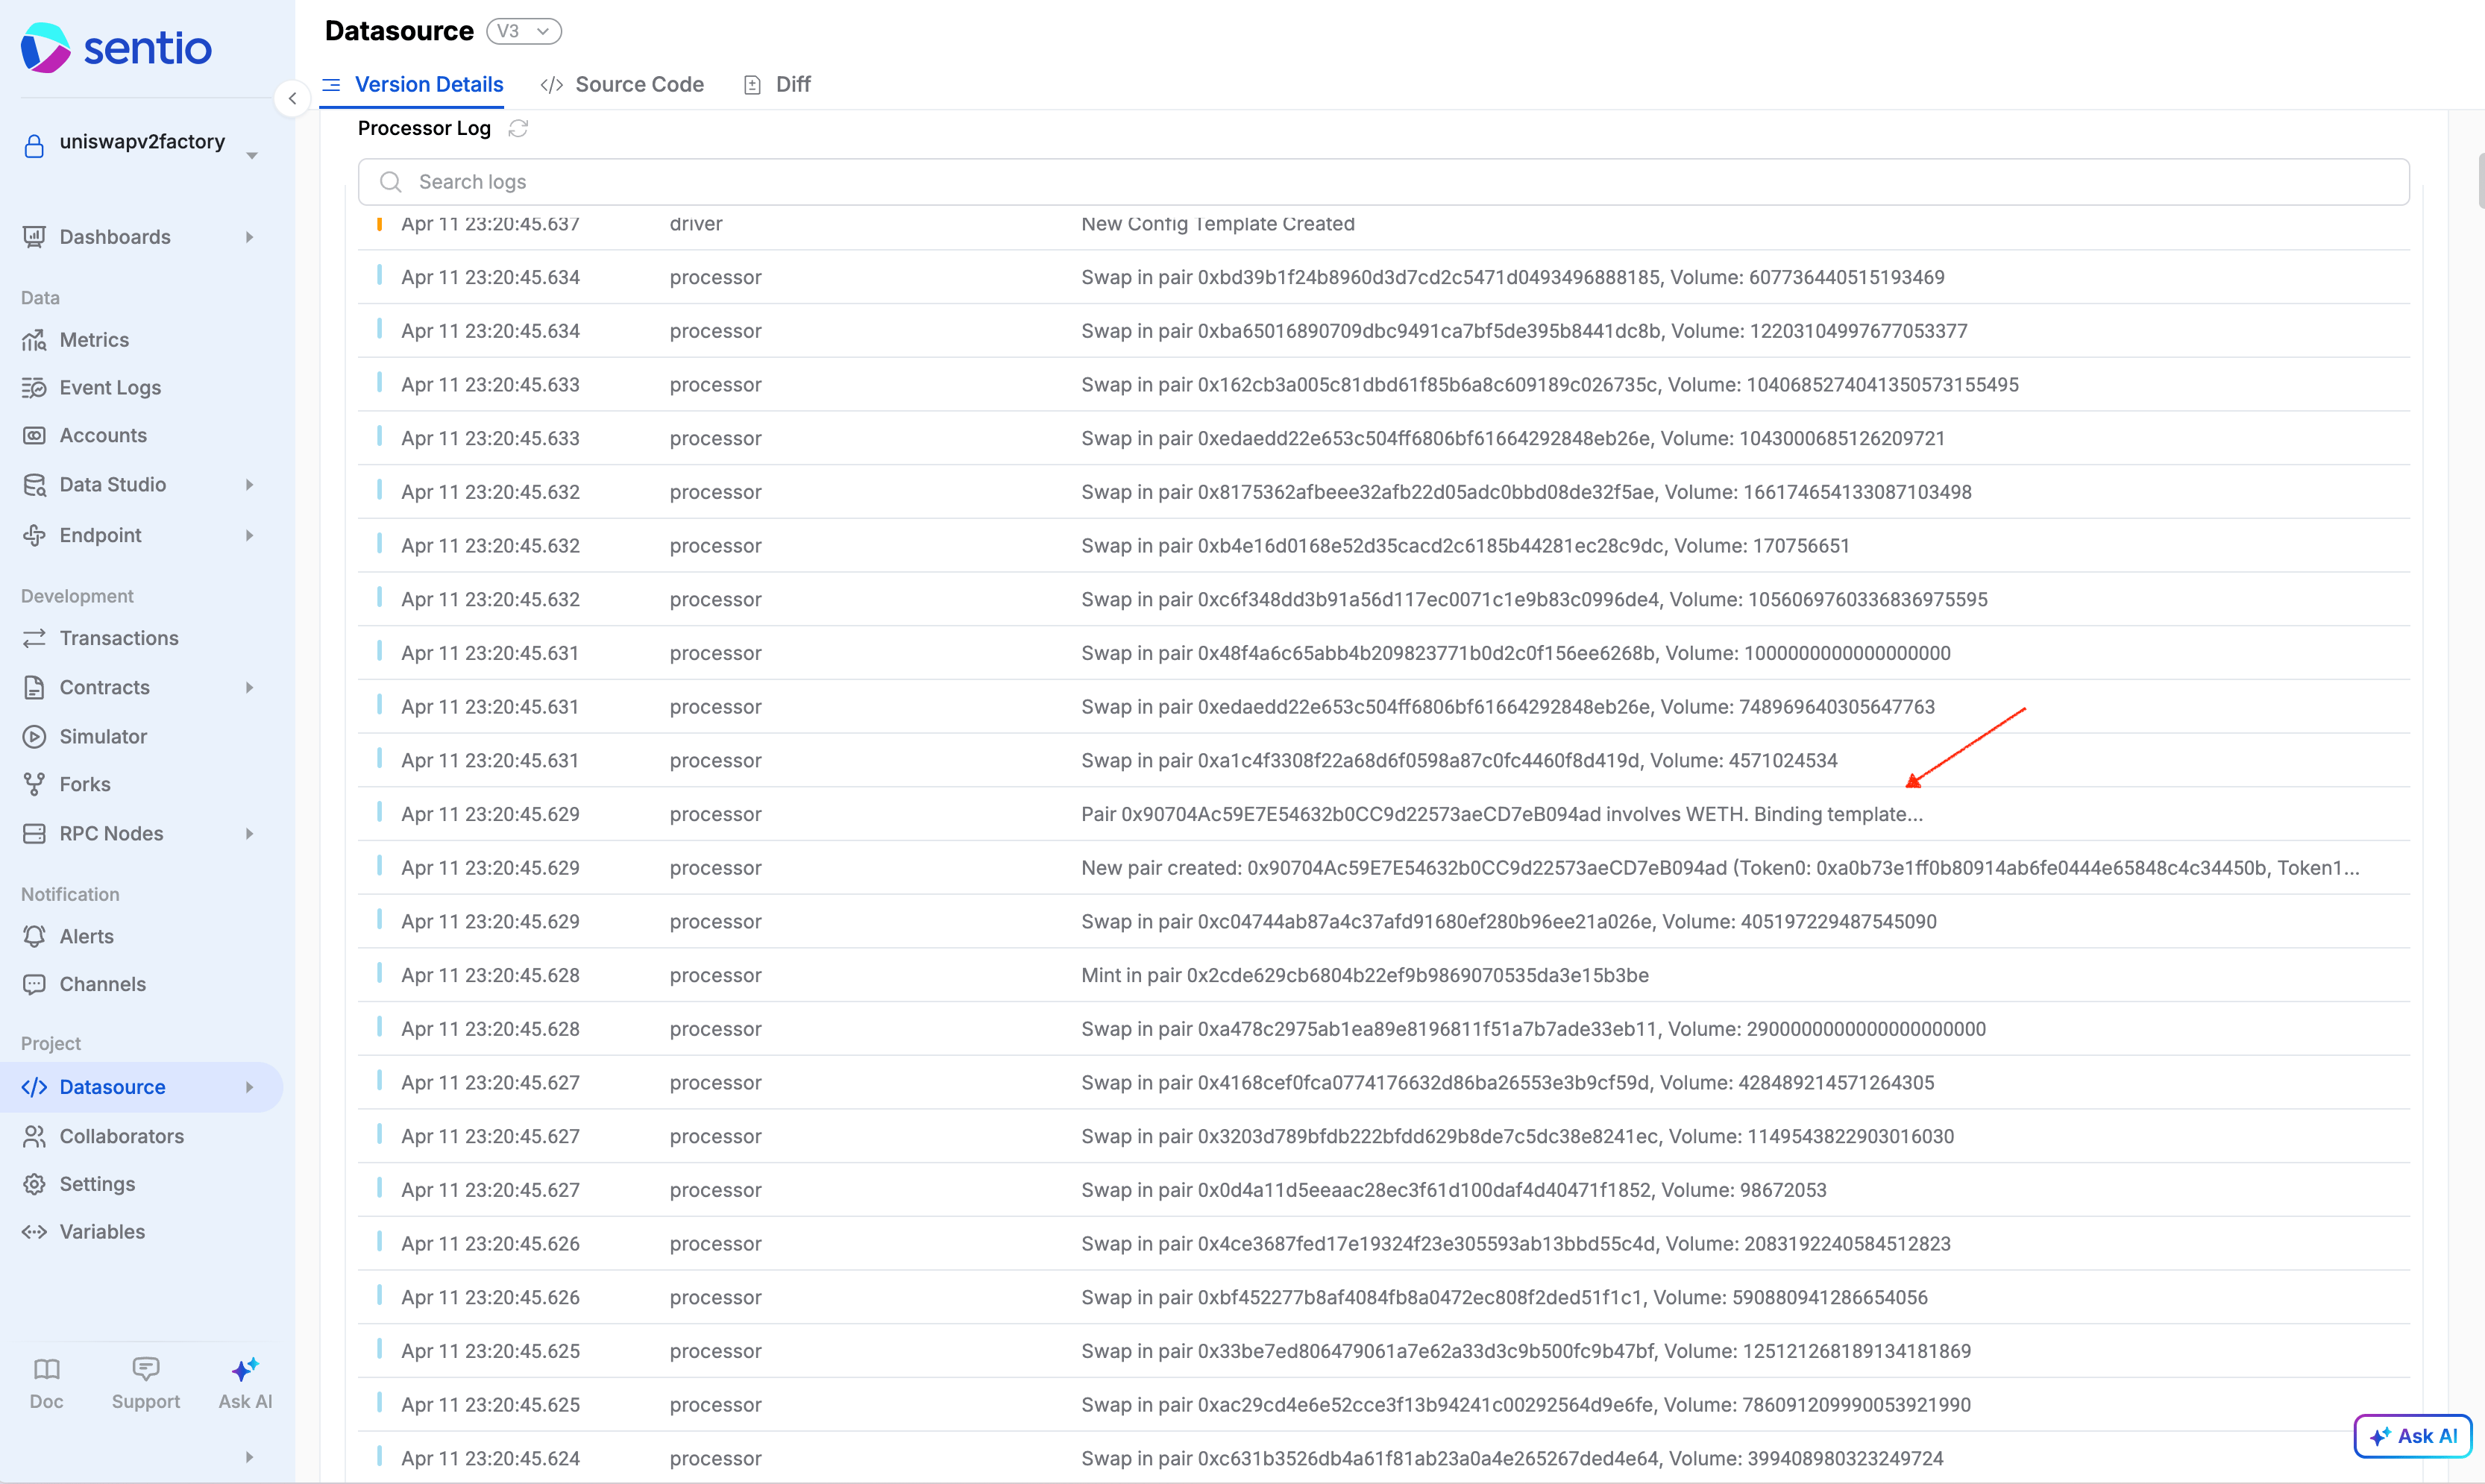
-
ctx.eventLogger.emit(): For more persistent and structured debugging, use event logs. Emit logs with detailed attributes at key points in your logic. These logs are searchable and filterable in the Sentio Event Logs UI.ctx.eventLogger.emit('DebugPoint_HandlerStart', { severity: LogLevel.DEBUG, message: 'Entering swap handler', pool: ctx.address, txHash: event.transactionHash }); // ... handler logic ... ctx.eventLogger.emit('DebugPoint_Calculation', { severity: LogLevel.DEBUG, calculatedValue: someIntermediateResult, inputArg: event.args.someInput });
Console output limits
Everything a processor writes through console.log, console.info, console.warn, console.error and console.debug is collected by the platform. Starting from SDK 4.5.0 the runtime caps that output, so a single processor cannot overwhelm log collection for everything running next to it:
| Limit | Default |
|---|---|
| Maximum size of one log line | 16 KiB |
| Maximum lines per second | 1000 |
| Maximum bytes per second | 1 MiB |
- A line longer than the size limit is cut and ends with
...[truncated by sentio runtime: line was N bytes, limit M]. When an object passed as an argument is too large to fit, its fields are dropped from the structured log entry and the message ends with...[N metadata fields dropped by sentio runtime: ...]. - Lines beyond the per-second budget are dropped. Once that second is over, a single warning line reports what was lost:
[sentio runtime] dropped N console log lines (B bytes) in the last second: output rate limit exceeded (...). console.debugoutput is only emitted when the processor runs in debug mode and is not counted against the budget otherwise.
If these notices show up in your console logs, the handler is logging more than the platform keeps. Log identifiers and short summaries instead of whole objects or arrays, avoid logging inside tight loops, and prefer ctx.eventLogger.emit() for structured data you want to query later.
When you run the processor runtime yourself, the limits can be changed with the environment variables SENTIO_LOG_MAX_LINE_BYTES, SENTIO_LOG_MAX_LINES_PER_SECOND and SENTIO_LOG_MAX_BYTES_PER_SECOND; 0 disables a limit.
Multi-version
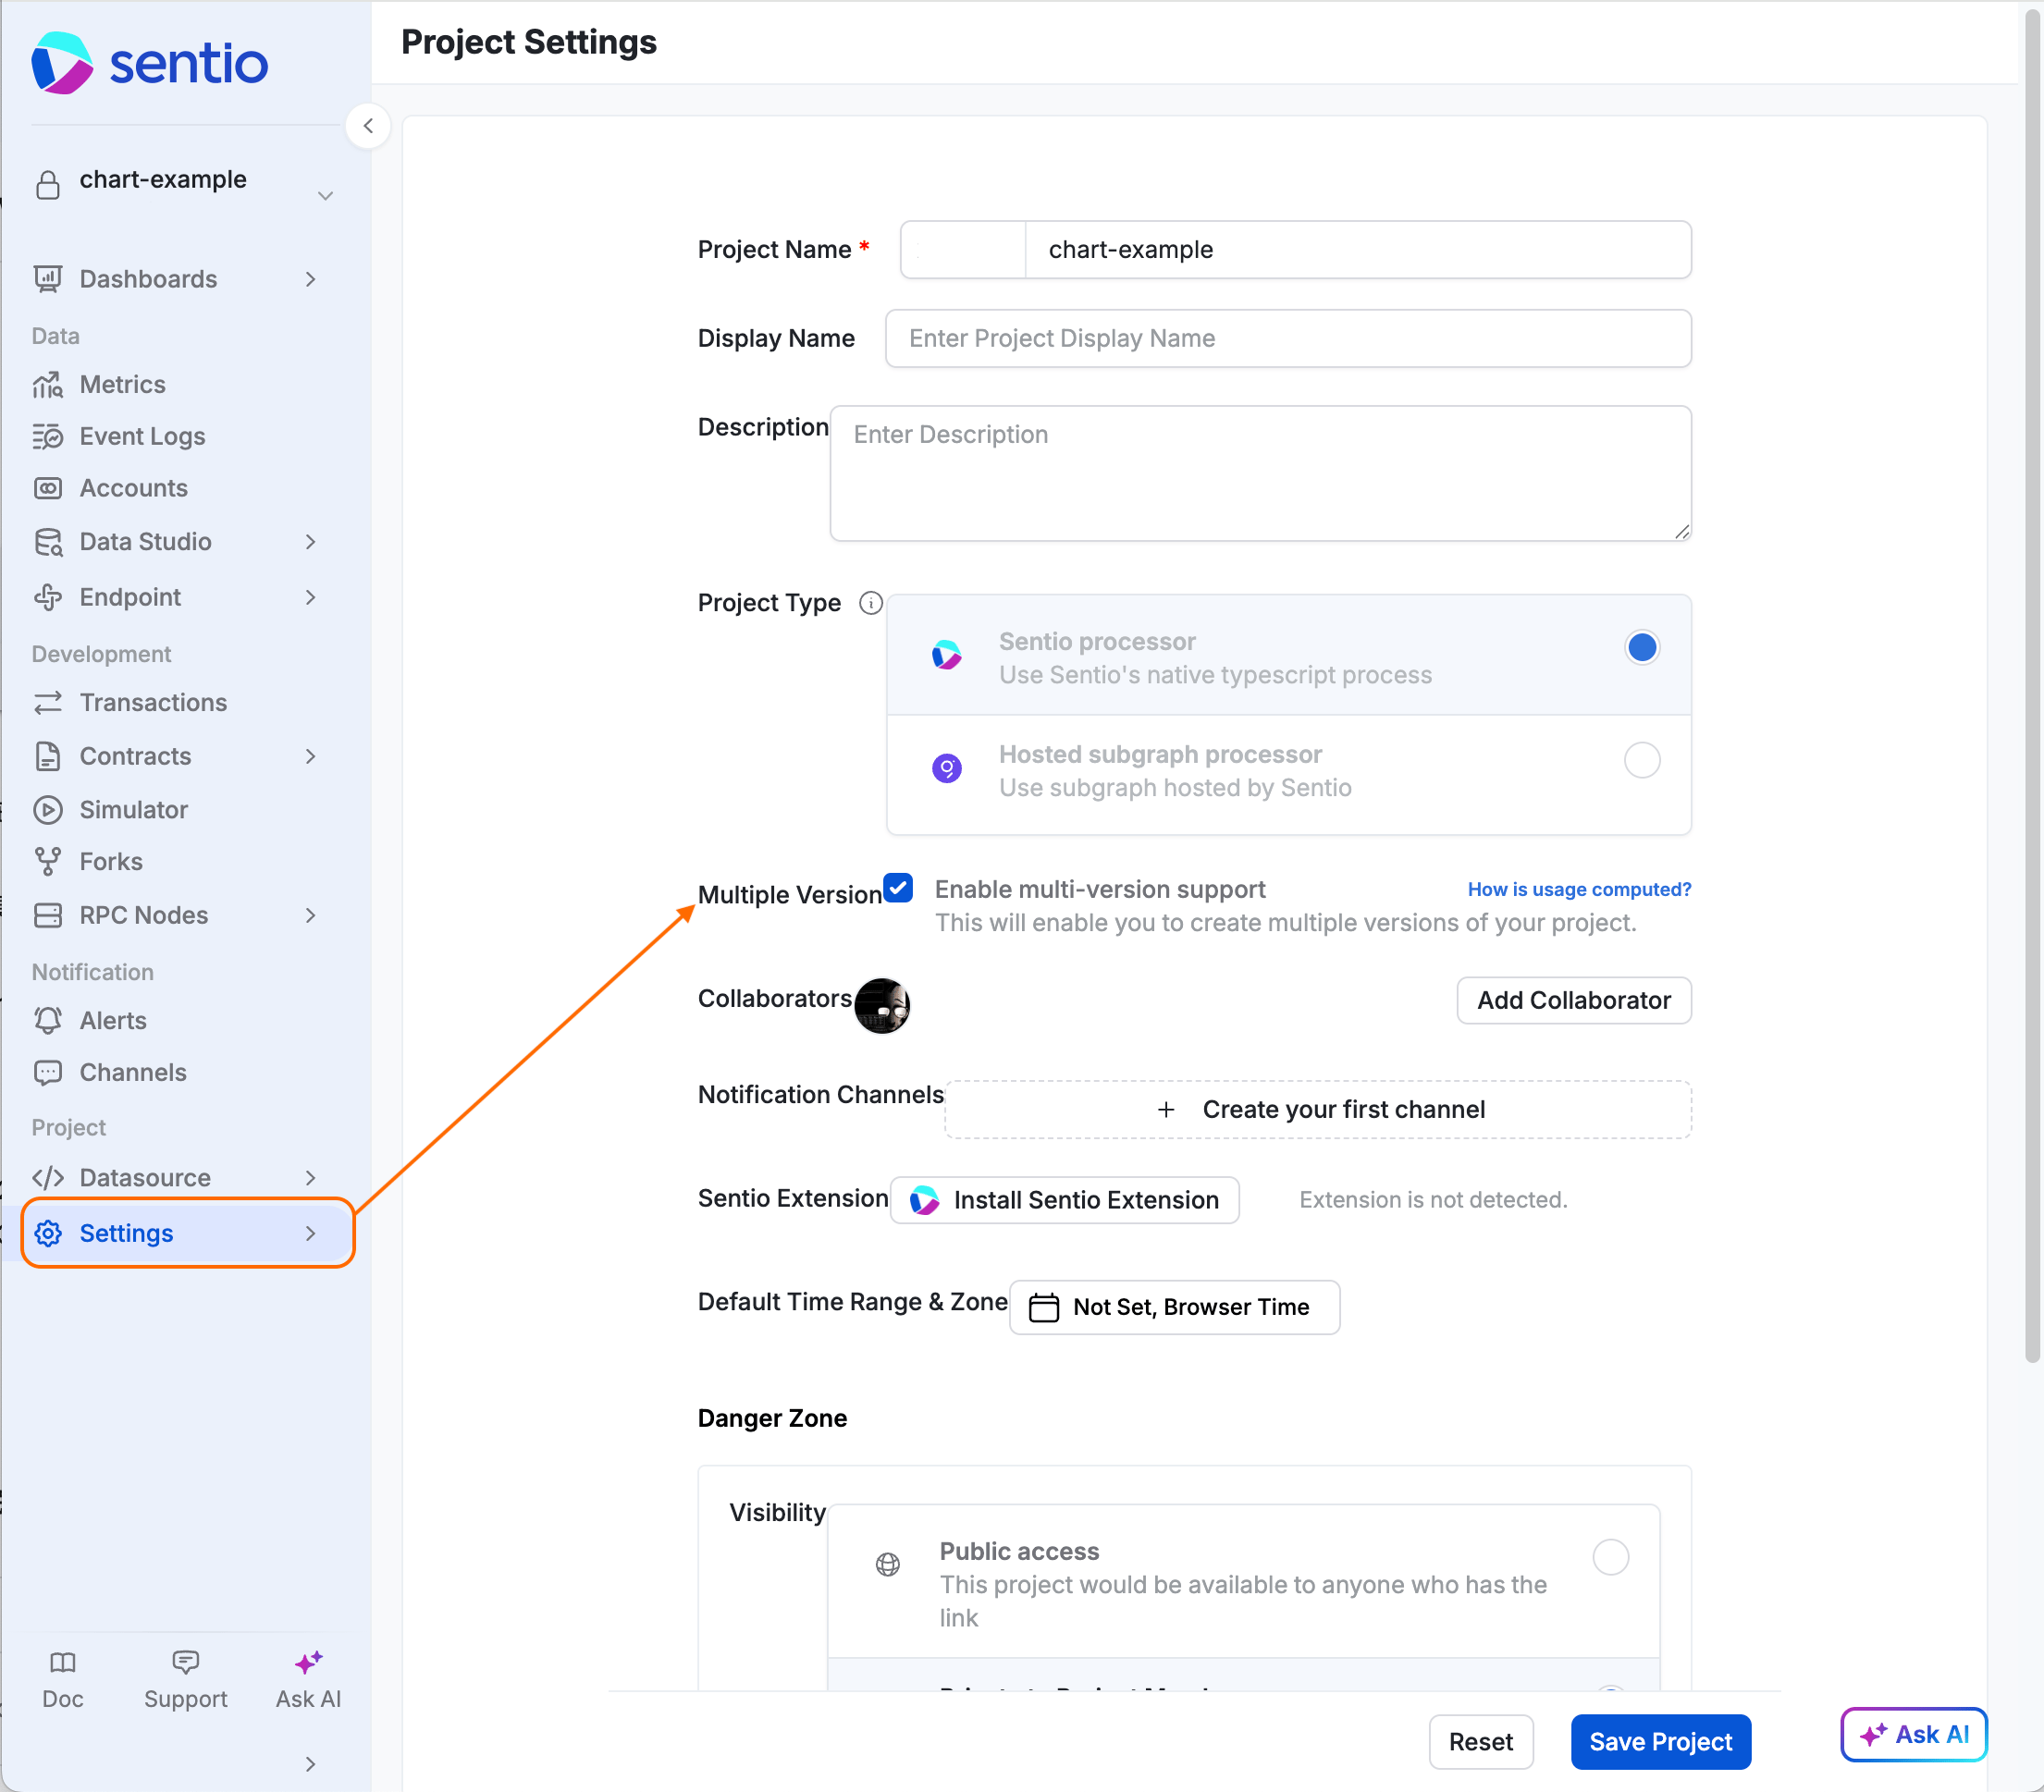
By default, every new upload overrides the previous upload. But users can enable multi-version from the Settings page.
Set active version
After you enable multi-version, your previous version keeps running until you explicitly switch the active version. The data of the old version will be deleted after a small delay.
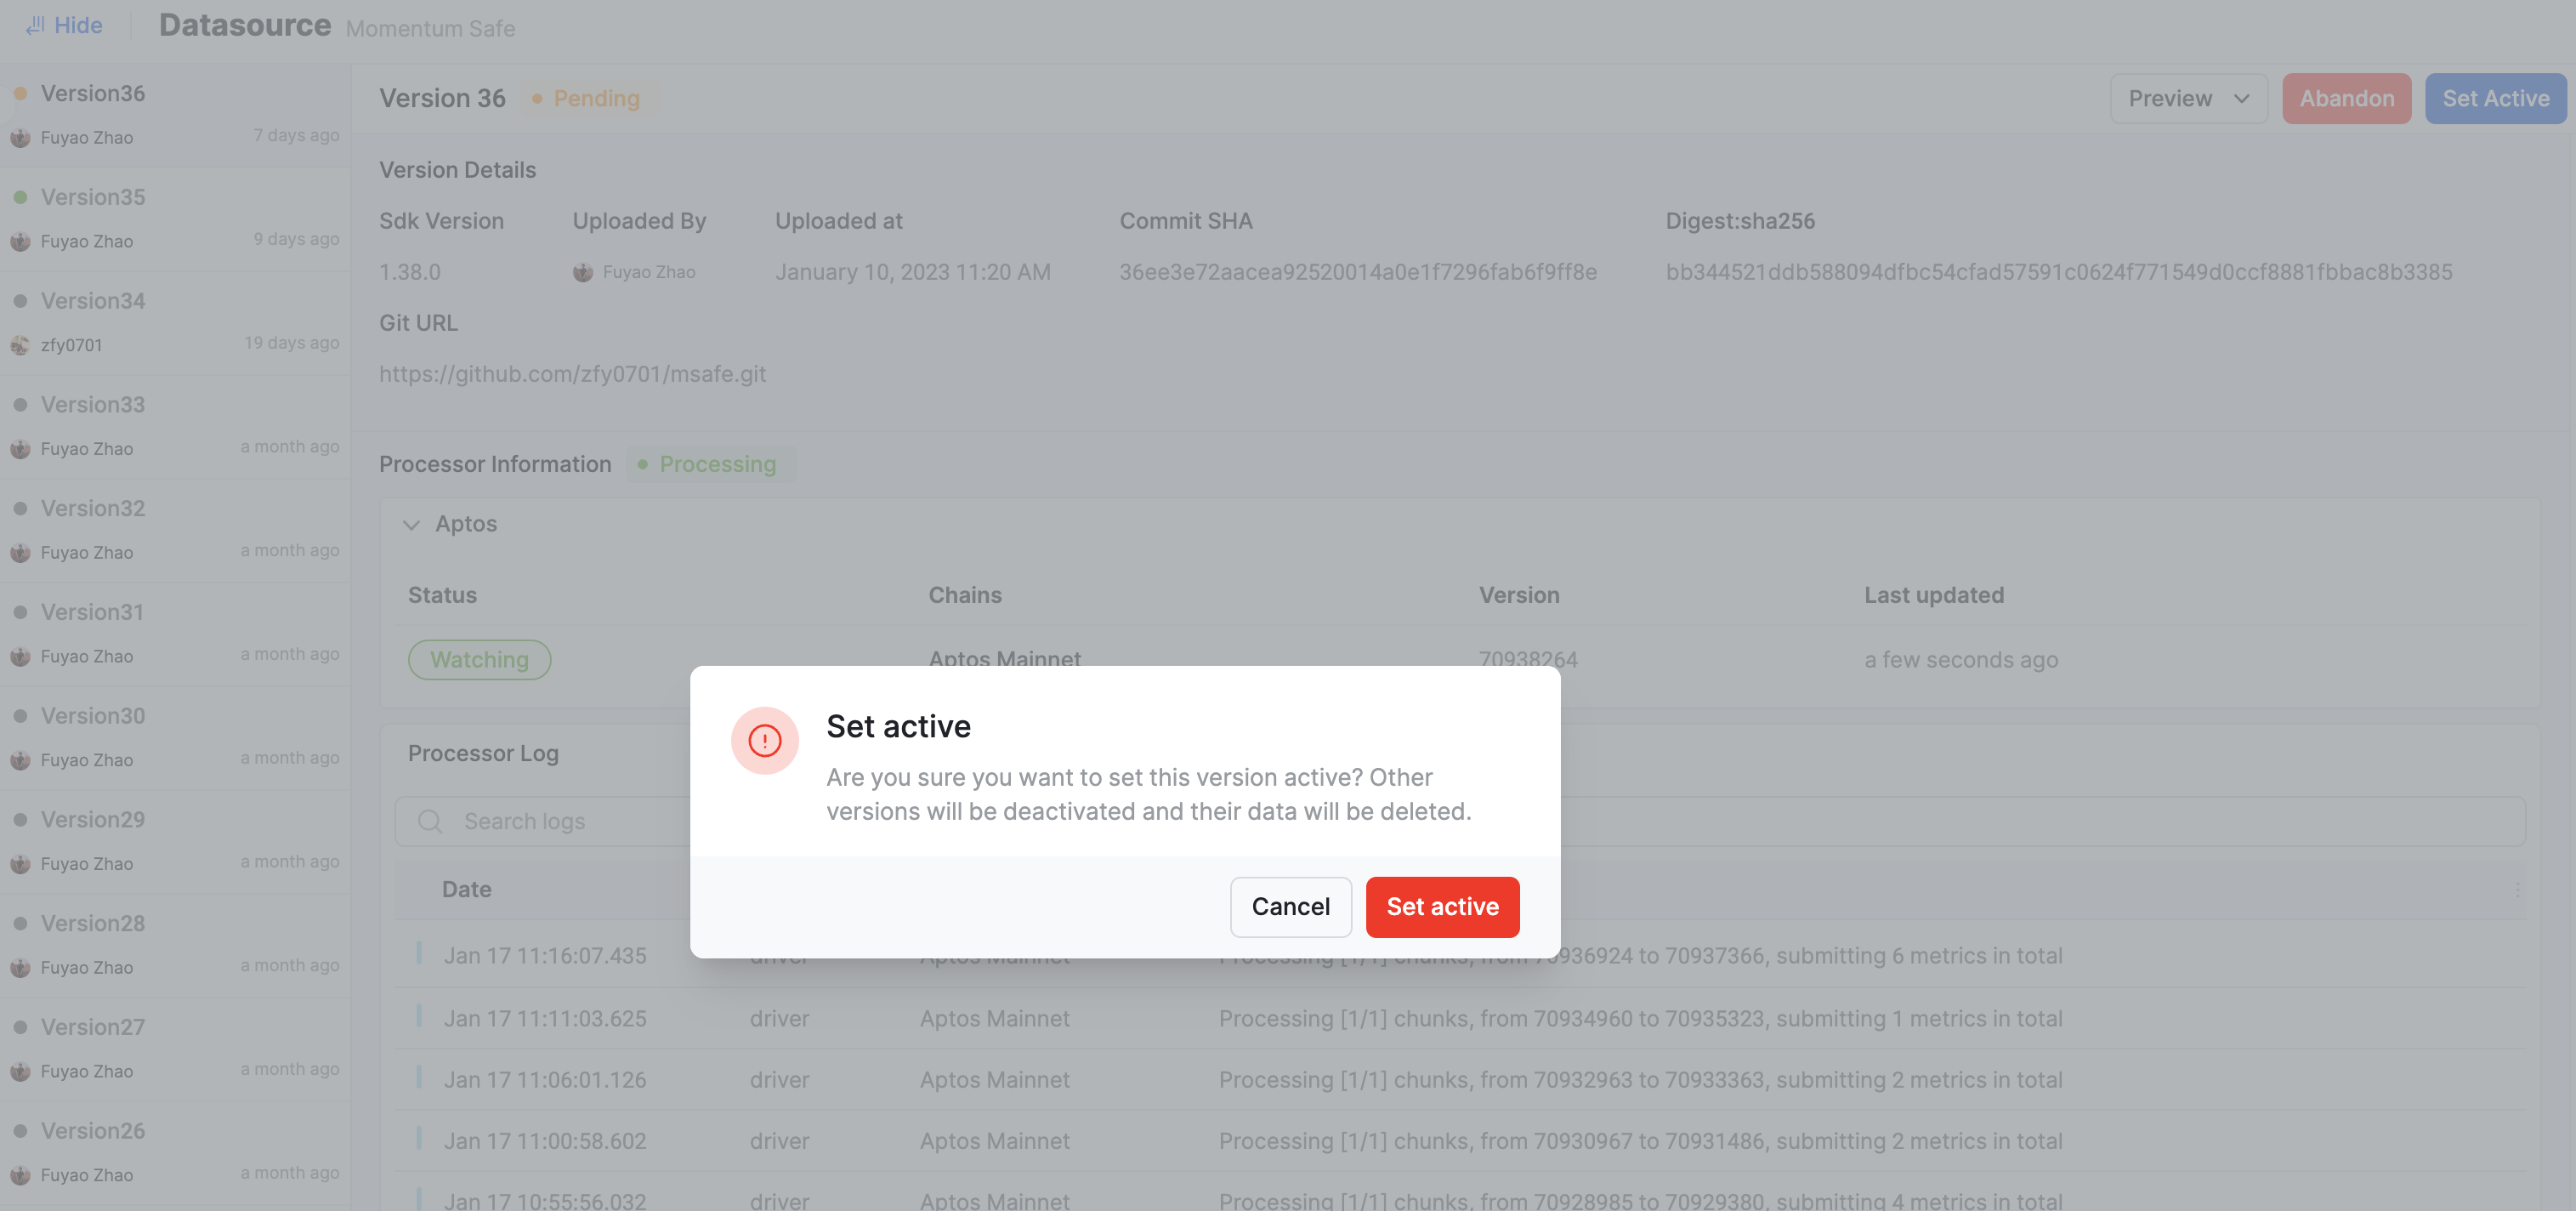
Abandon a version
It is possible that you upload a new processor and find an issue in it. You can always abandon it and work on a new version.
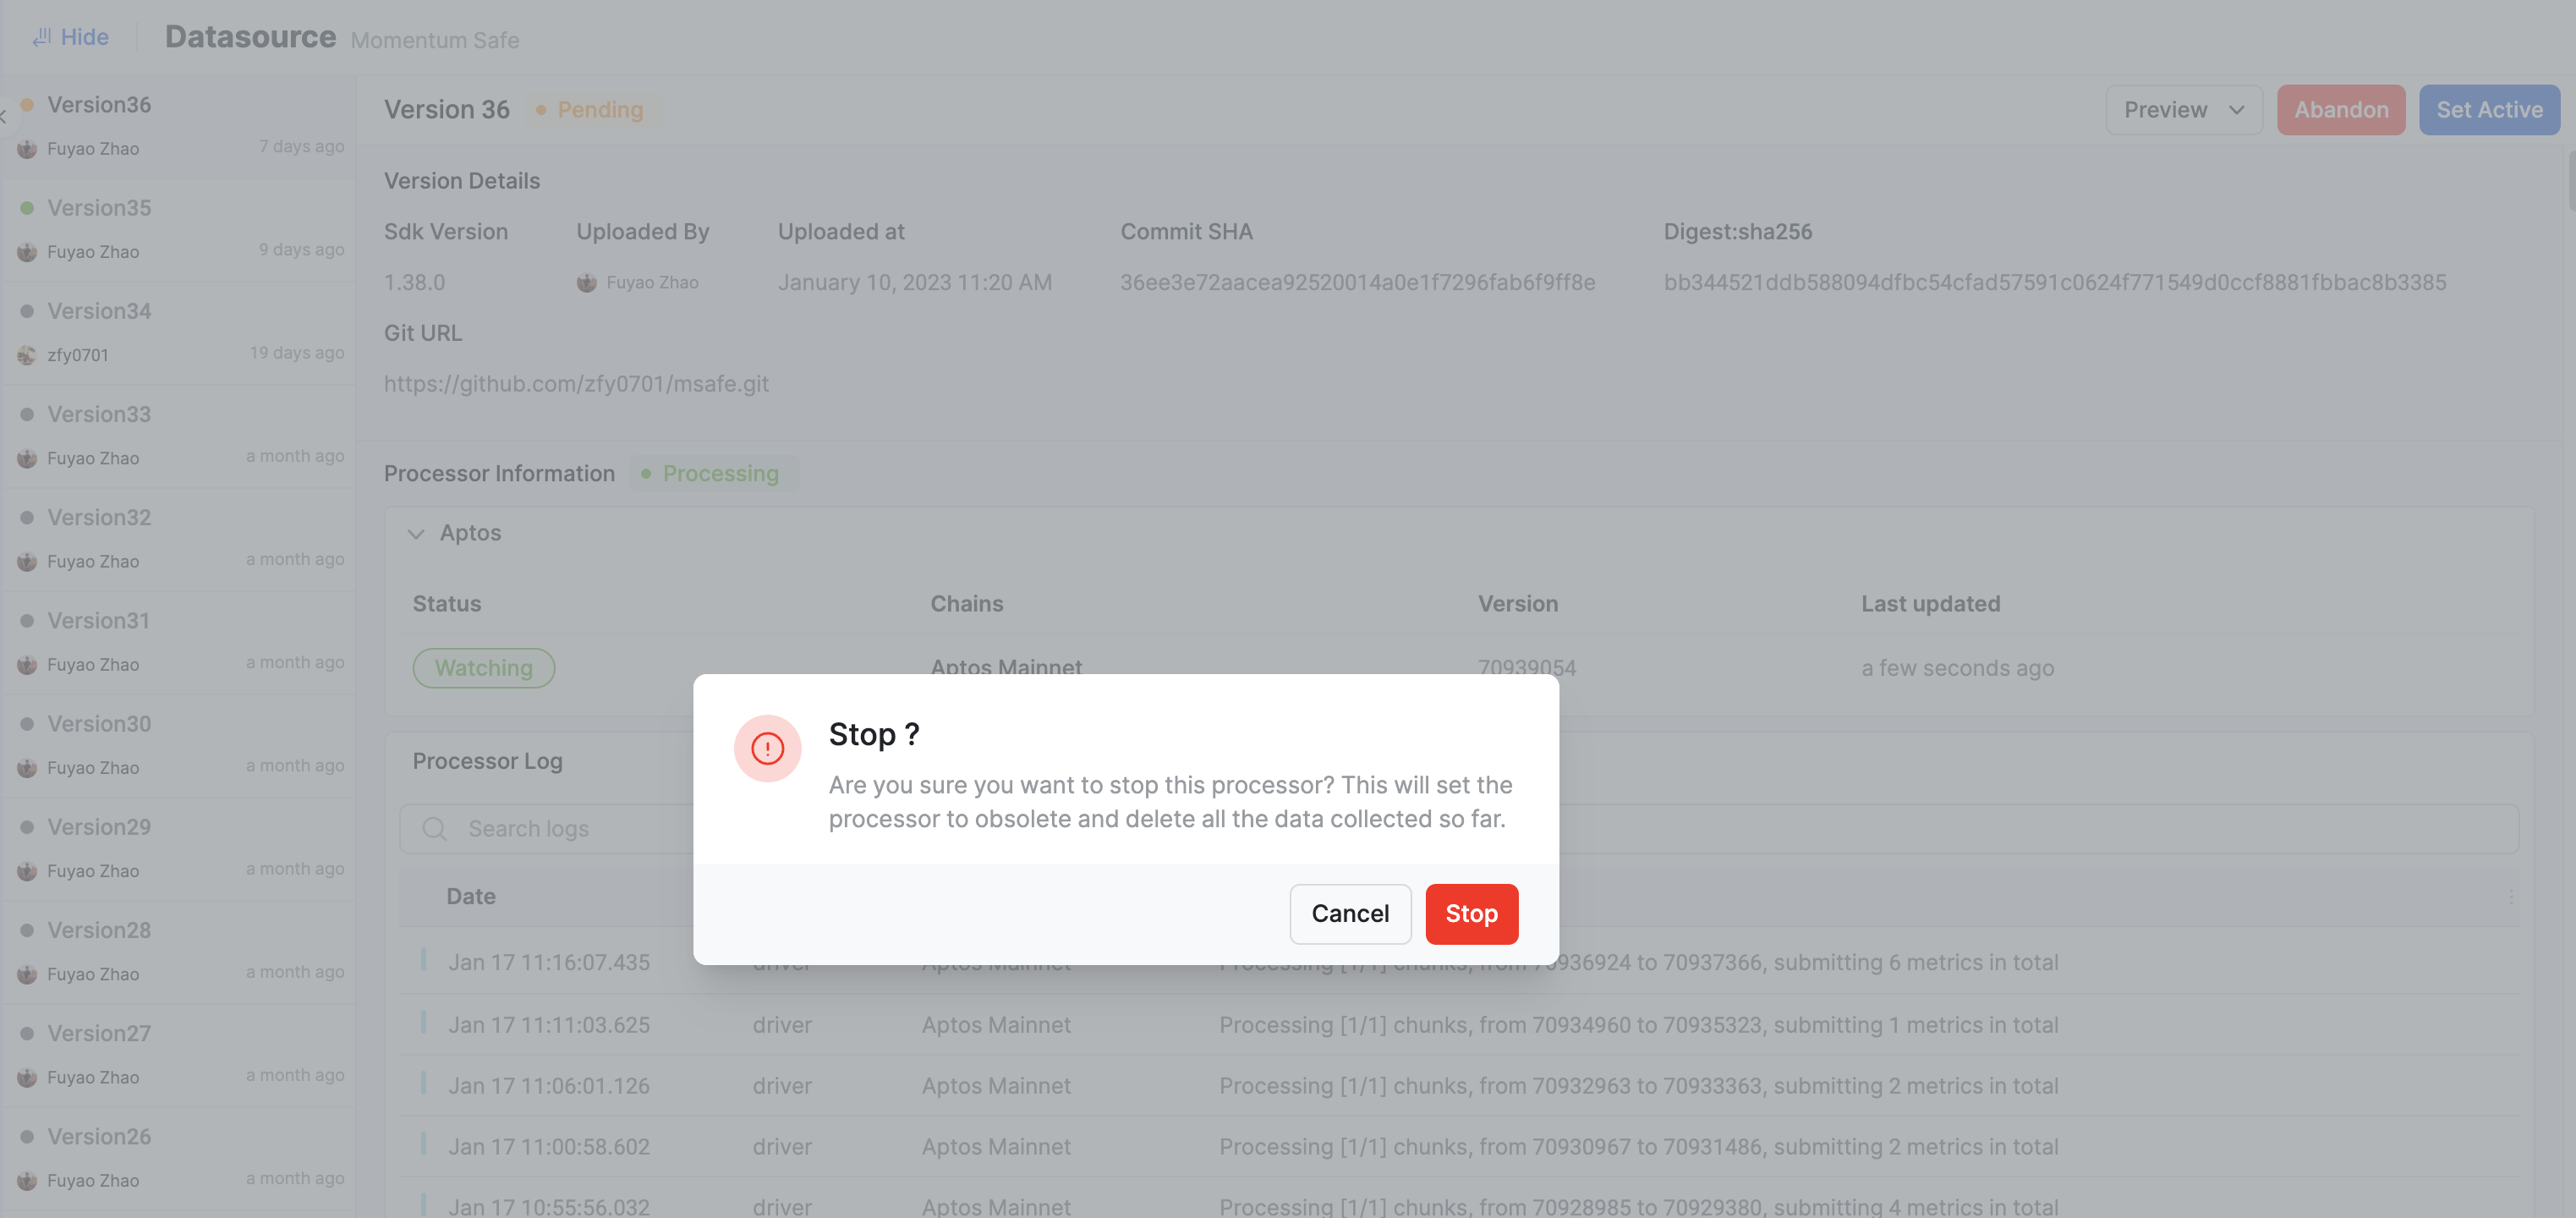
We support at most 2 versions with running processors and data stored. It means that you can have at most one active version and one pending version.
Hotswap in Version
Sometimes, you may want to upgrade the processor code to prepare for contract change, but don't want to spend too much time waiting for re-index if you have a very long backfill time.
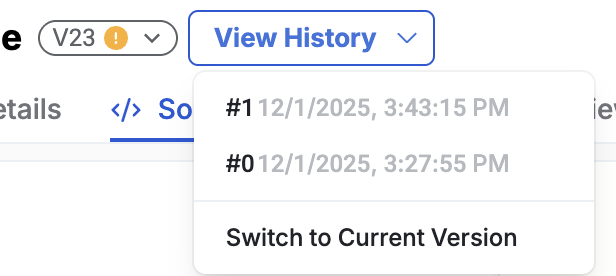
We support continue-from from when uploading the processor code, it will update the processor code in current version and keep the previously indexed data. e.g.
yarn sentio upload --continue-from=<old version>Refer Sentio CLI and Subgraph CLI for detail usage. After uploading, you will see version histories:
Processor Rollback
There are cases where previously mishandled data leads to dirty or inconsistent results (for example, a bug that was triggered only during a certain time window). In these situations, Hotswap alone isn’t sufficient.
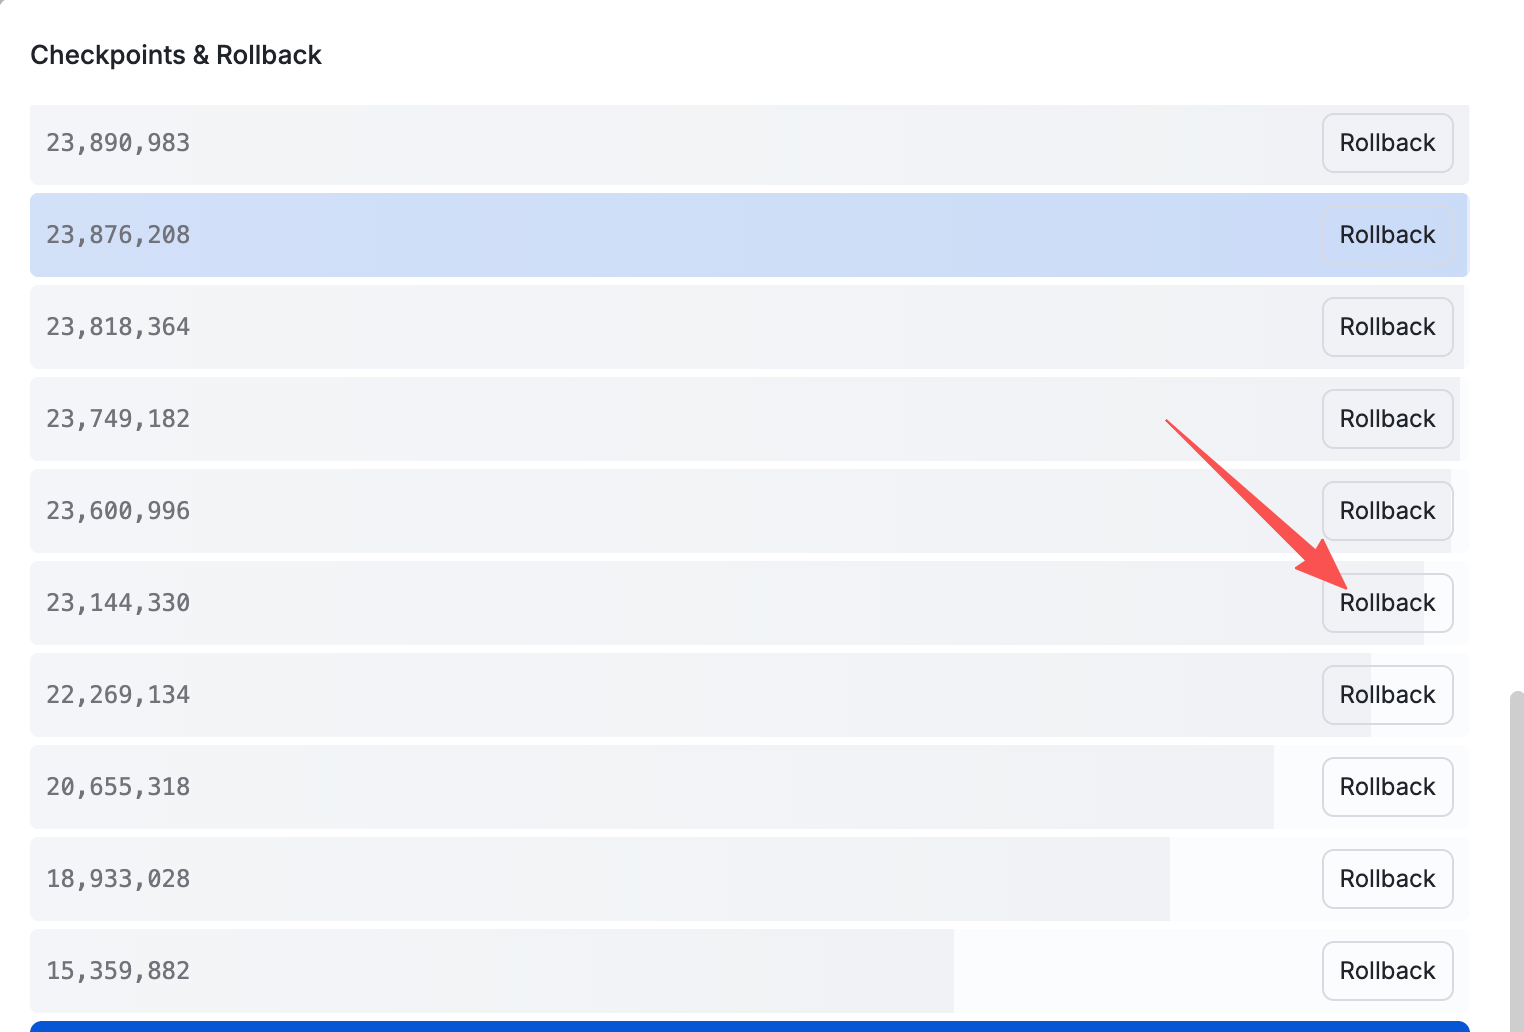
Starting from SDK 3.x, you can now view the full list of checkpoints maintained by the Sentio Processor and instruct the processor to roll back to an earlier state. After the rollback, the processor will enter a paused state, allowing you to use Hotswap to fix the indexing logic before resuming execution.
You can click the "Checkpoints" button on the Processor status page. Each chain maintains its own checkpoints.

Once the list of checkpoints appears, click the "Rollback" button.