

Use Data🔍 Visualizations
⚡ Event Analytics Dashboard
Event Analytics Dashboard is used to visualize data submitted by event-logs.
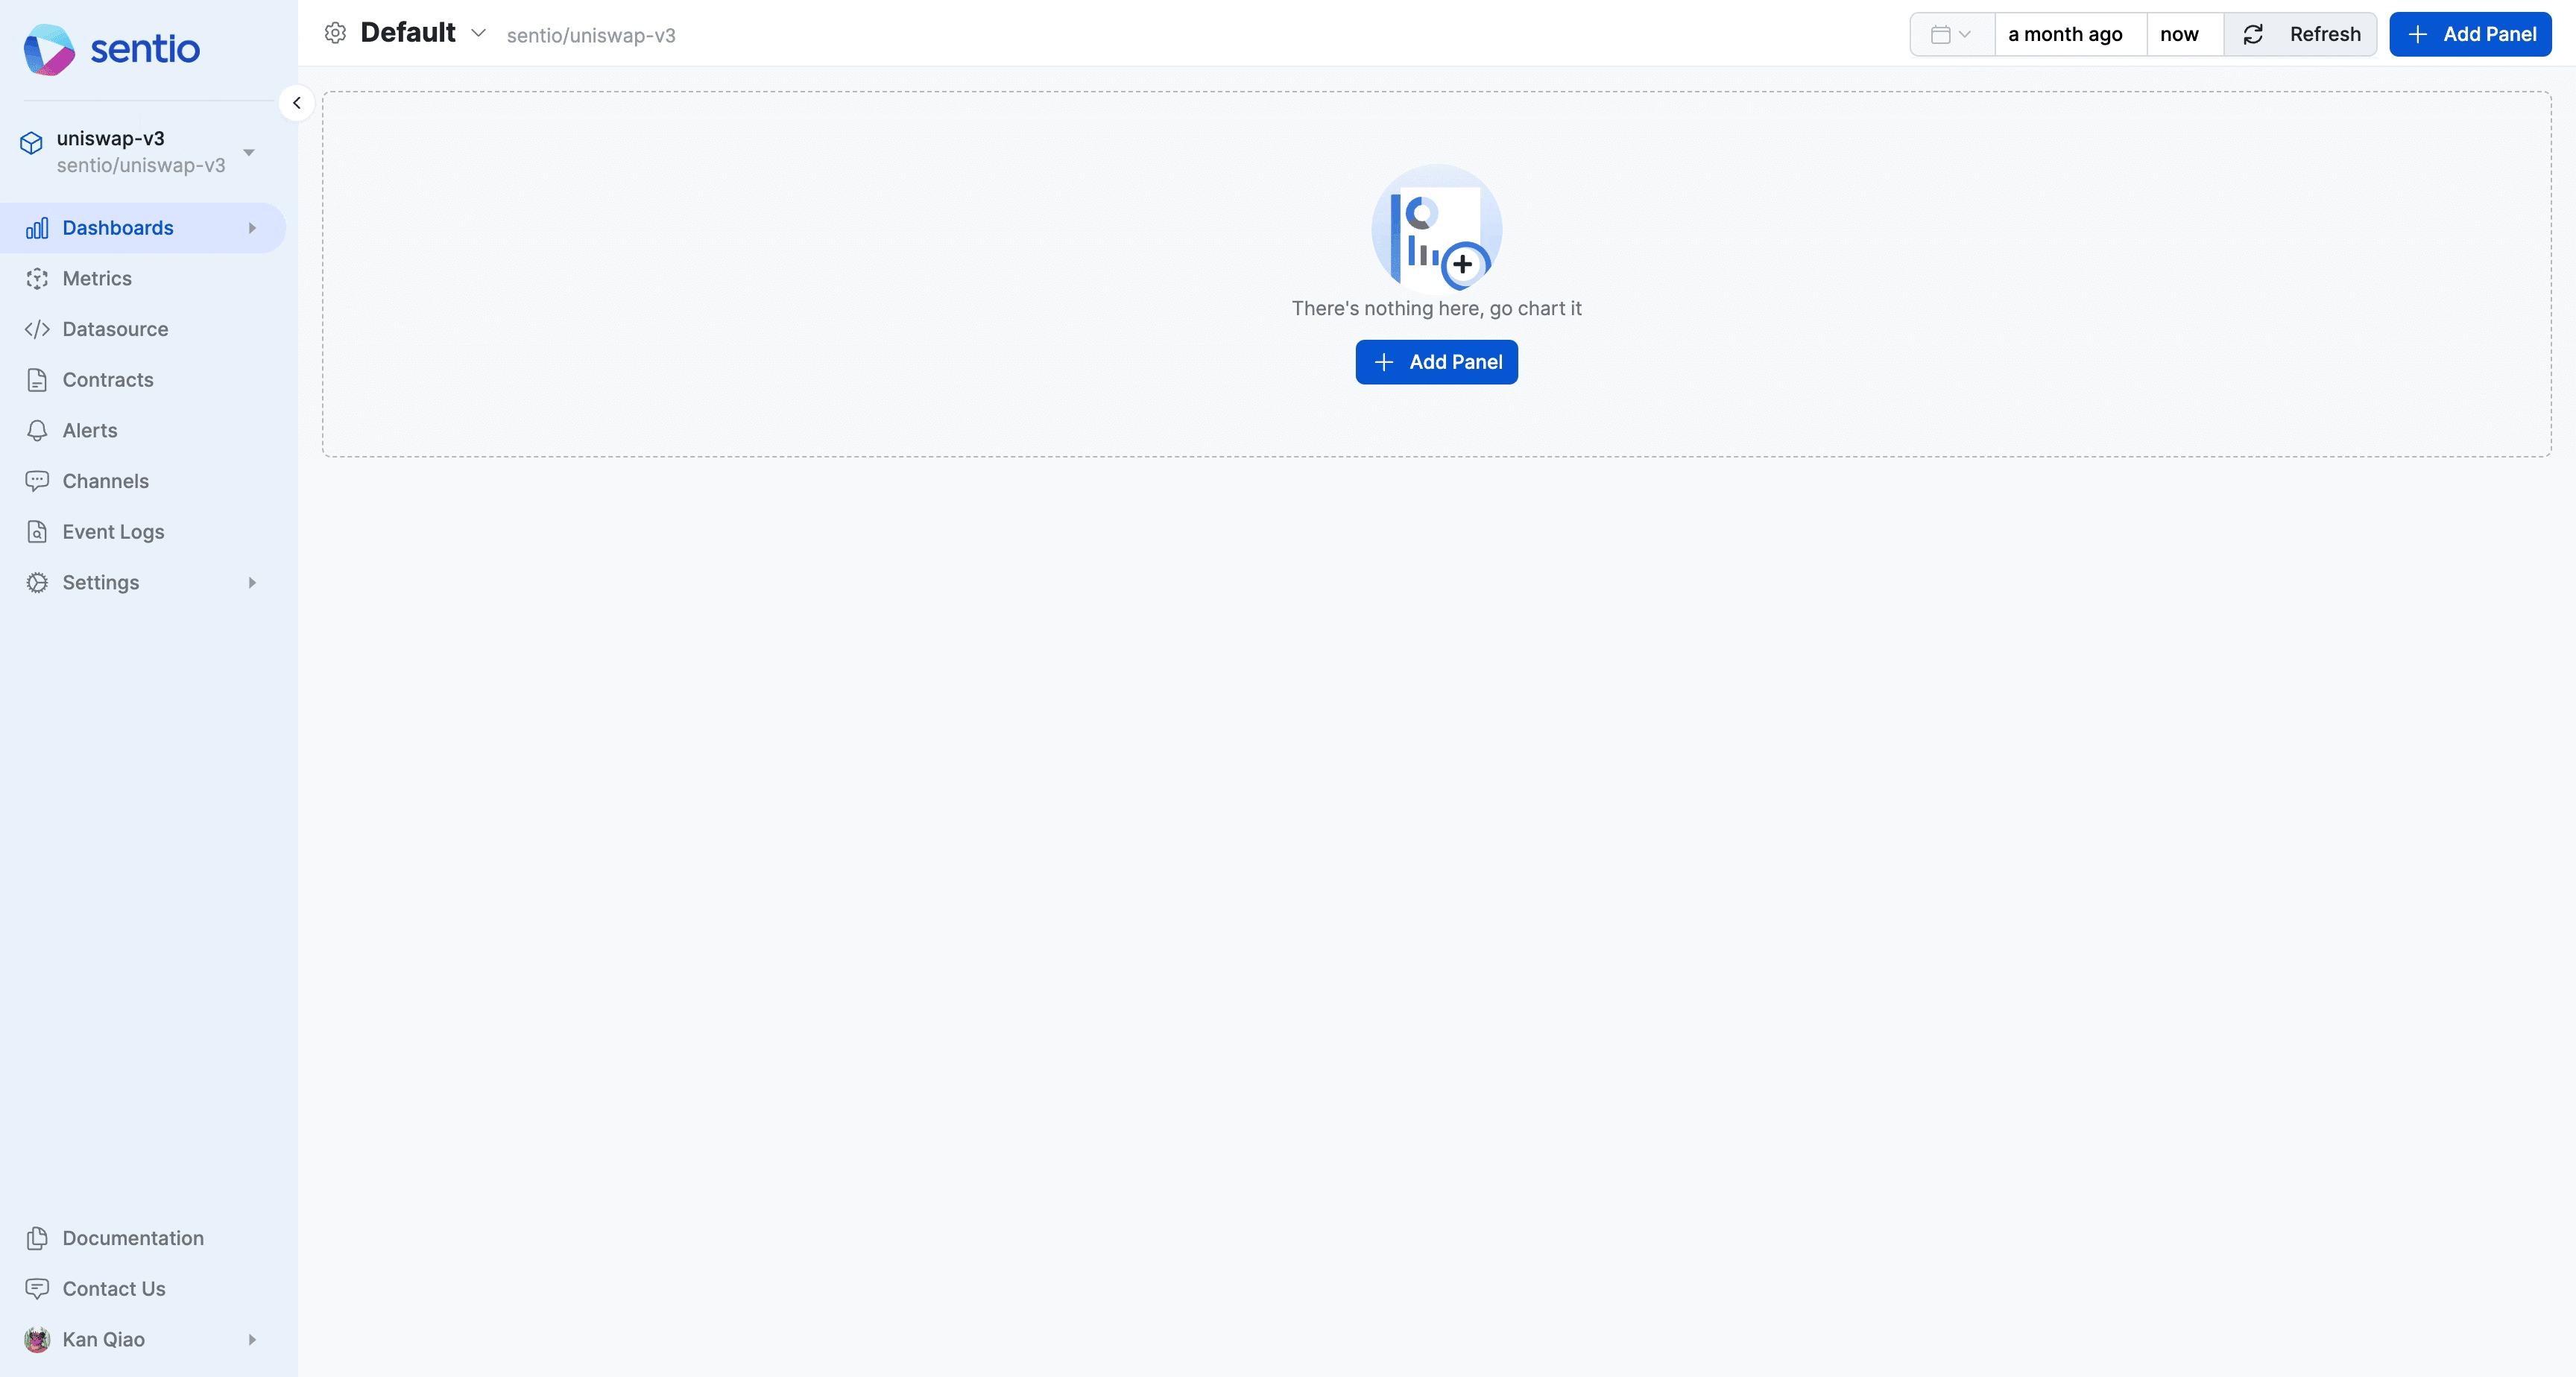
Here is one example where we make a dashboard for Accumulative Unique Users:
⚠️
This requires that events were submitted with #distinct-id.
All Events
All Events is a union of all the events submitted. It is a handy way for us to compute the Accumulative Unique Users of all your data.